Astronomical Computing
Can Comet Hunters Survive?
Written by Toshimi Taki and Shigeki Murakami
Prepared on September 23, 2003
=====================================================
Shigeki Murakami, co-discoverer of Comet C/2002 E2 Snyder-Murakami, published an article on impact of SWAN and NEO sky survey on amateur comet hunting in "Tenkai (The Heavens)" (the bulletin of Oriental Astronomical Association). When Murakami's article appeared in 2003, Toshimi Taki was conducting simulation of comet hunting competition between amateurs and NEO sky survey. Taki sent an e-mail to Murakami to ask him to help the study. This article is the result of the collaboration.
Toshimi Taki made a presentation of the simulation of comet hunting competetion at the 34th Comet Conference held on March 6-7, 2004 in Azumino, Japan. Following is the English version of the presentation.
=====================================================
Right click here to download this article in pdf file (215KB).
See also
Shigeki Murakami's Web Page.
1. Introduction
Since the Charles Messier's era, visual comet hunting has been a fascinating field for amateur astronomers. Dedicated comet hunters win honor and feel a sense of achievement for comet discoveries. However, in the late 1990s, automated sky survey programs for Near Earth Objects (NEOs) started routine operations and discovering many comets as well as asteroids (Sky & Telescope, December 2000, p. 32). The amateur comet discovery seemed to decline since then.
Especially, the situation looked serious in the northern hemisphere; many comet seekers stopped hunting in Japan discouraged by NEOs in those days. One of the authors, Murakami, also quitted hunting once. However, he resumed it with a large aperture telescope and luckily enough he could find a new comet, C/2002 E2 Snyder-Murakami.
Incredibly, five comets were visually discovered in the northern hemisphere in that year, 2002. On the contrary, in the same year a new kind of shock was given by Masayuki Suzuki's discovery of comet C/2002 O6 SWAN from the SWAN (Solar Wind ANisotropies) images these which are open to the public on the web site. Most comet observers thought faint comets could be found in SWAN images before amateur comet hunters' discovery.
Among serious Japanese comet observers, there were hot discussions whether comet hunting can survive or not under the threats of NEOs and SWAN.
Is it rarely accidental occurrence that five comets were visually discovered in 2002?
Can you actually detect all the comets from the SWAN images that could be visually discoverable?
What would have become of the future visual discovery?
To answer those questions we will conducted an objective evaluation on comet discoveries. This study owes much to the discussions we had with Japanese amateurs.
2. Threat of SWAN
Syogo Utsunomiya, the most successful comet hunter in recent years, emailed one of the authors Murakami in October 2002; "I am worried myself about Masayuki Suzuki's discovery of comet C/2002 O6 SWAN from the SWAN images. Can we comet hunters survive?"
Utsunomiya was dismayed to read the Japanese astronomical magazines which said that all the comets brighter than some 11th magnitude would be found by SWAN. However, he thought fainter comets could be still detectable visually using a large aperture telescope like Murakami's, though Utsunomiya's 15 cm binocular was too small for this purpose. Utsunomiya could not stand uneasiness any more and consulted Murakami about usage of large aperture.
Murakami did not worry much about SWAN because few comets were discovered by SWAN before the finding of C/2002 O6 SWAN. However, he was anxious about it after receiving the email and decided to inspect the SWAN images to confirm if they could had detected visually discovered comets prior to the actual discoveries the visually discovered comets could have been detected prior to the actual discoveries.
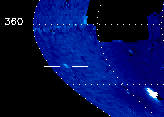
Figure 1. SWAN image of Comet 153P Ikeya-Zhang. Two weeks before the discovery
The result was unexpected: only one comet, 153P Ikeya-Zhang, out of six visually discovered in 2001 and 2002 could be discoverable from the SWAN images by his eye. One reason is that the SWAN images were not open to the public at the time of the discovery and/or a new comet was near the sunSun and out of SWAN's coverage. Another is much more fundamental: many Japanese comet observers claimed that they could catch caught pre-discovered comet pictures on the SWAN images because they knew the position of the comets. These images are very faint and dim, looks like stain or ghost, and therefore you cannot detect them unless you know the positions. To observe a known comet is one thing and to find a new comet is another. This holds true whatever you use; a picture, a CCD, the SWAN images and visual observation.
Murakami concluded "no need to worry about SWAN" and emailed this result to Utsunomiya. He replied, "Your analysis is a great comfort to me. Some people might say, 'Oh! You still continue to comet hunt? You are a living fossil.' It is true that the chance of discovering a new comet may have reduced but you cannot claim that it is impossible. I will go on comet seeking relying on my eyes and instrument."
3. Threat of NEO Sky Survey
We evaluated the threat of NEO sky surveys in two ways, actual comet discovery statistics and simulation of comet discovery. The simulation enables us to study each element which affects the comet discovery.
3.1 Analysis of Actual Comet Discovery
The analysis here is based on the data in Tenmon Nenkan (Astronomical Almanac) published annually by Seibundo-Shinkosha, Tokyo, Japan. Tenmon Nenkan lists dates of discovery, orbital elements and magnitude at discovery for all the new comets found in the previous year. Comet discovery data from November 1986 to December 2002 are studied below. Comets with very long period and parabolic/hyperbolic orbit (eccentricity > 0.93) are studied.
The first figure shows trend of discovery. From 1998, discovery of comets with larger perihelion distance increased abruptly. This corresponds to full operation of LINEAR (Lincoln Near Earth Asteroid Research) project. The trend began in early 1996 when NEAT (Near-Earth Asteroid Tracking) program began to full operation. Thus, we can identify two periods, "Before NEO Sky Survey" and "After NEO Survey". "Before NEO Survey" ended in December 1995 and "After NEO Sky Survey" started from March 1998. From January 1996 to February 1998 is a transition period.
The second figure shows a comparison of comet discovery per year between the two periods. The difference is very clear. Professional comet discovery increased 6 times and visual comet discovery by amateurs in the northern hemisphere decreased to half after NEO sky survey. Amateur discovery from southern hemisphere does not decrease though.
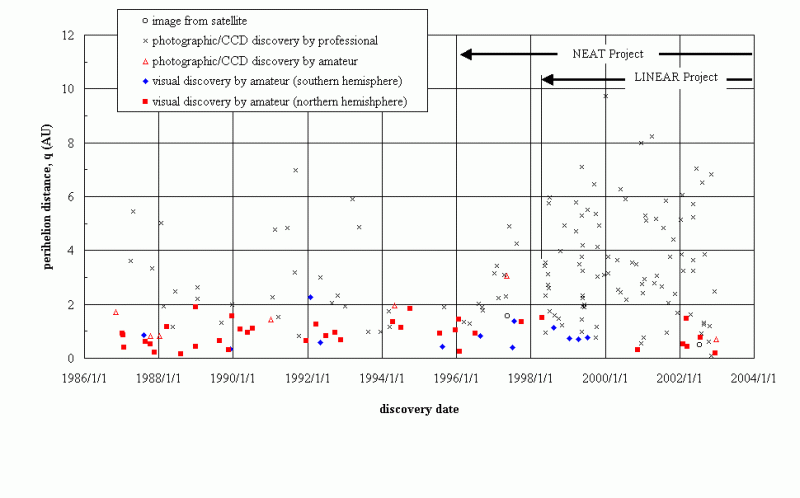
Figure 2. Comet discovery trend
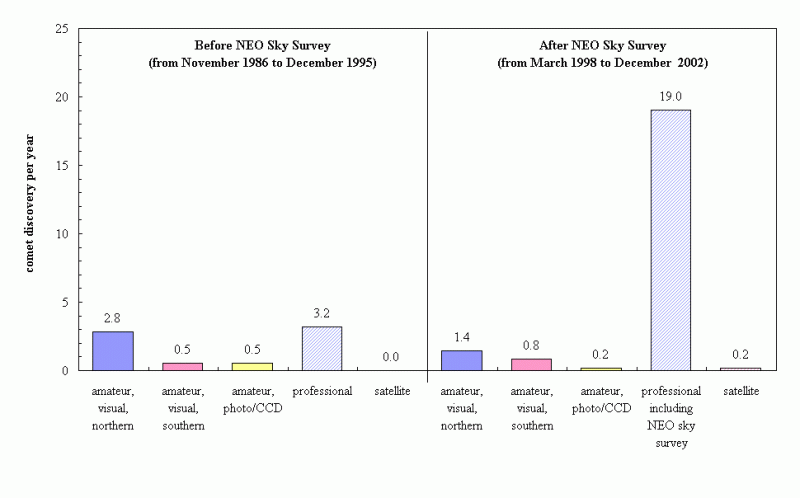
Figure 3. Comet discovery statistics for "Before NEO Sky Survey" and "After NEO Sky Survey"
This figure does not include discoveries by SOHO (Solar Observation and Heliospheric Observatory) satellite except by SWAN which is one of the instruments boarded on SOHO.
Position of each comet at its discovery was calculated using the orbital element and the discovery time. Further analysis reveals more interesting facts.
3.1.1 Absolute Magnitude Distribution
Absolute magnitude of comet is defined in the following equation.

where,
m: Magnitude of comet
H10: Absolute magnitude
 : Distance of comet from the Earth
r: Distance of comet from the Sun
Absolute magnitude of each comet was calculated from the comet magnitude and its position at the discovery. The relationship between absolute magnitude and perihelion distance are shown in the figures below for both before and after NEO survey. Amateur visual discovery is limited to the comets with small perihelion distance, q < 2. NEO sky survey extends the limiting perihelion distance further. It is interesting that there is no amateur comet discovery brighter than 6.0 in absolute magnitude after NEO survey, though the number of samples is not enough. We will discuss this trend later using simulation.
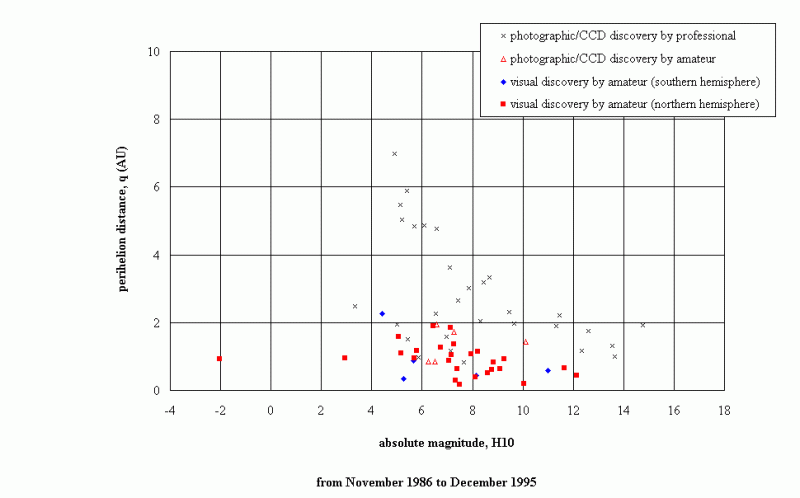
Figure 4. Absolute magnitude and perihelion distance plot for "Before NEO Sky Survey"
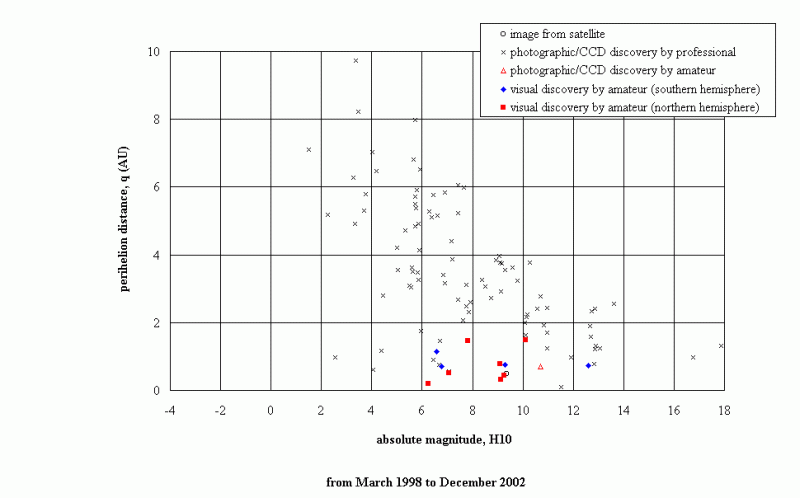
Figure 5. Absolute magnitude and perihelion distance plot for "After NEO Sky Survey"
3.1.2 Comet Position at Discovery
Comet positions at discovery are plotted in the figures below. The positions are expressed in ecliptic coordinates and longitude difference between comet and the Sun. A line of elongation of 80-degeee is also plotted in the figures. Visual discovery before NEO sky survey mostly occurred in the region within 80-degree elongation. On the contrary, almost all the professional discovery occurred in the region beyond 80-degree elongation. Tsutomu Seki, the co-discoverer of the famous Comet Ikeya-Seki, pointed out that the sky coverage of the automated sky surveys is limited beyond 80-degree from the Sun and there is a good chance to discover comets visually in the sky near the Sun.
Note that discovery in the morning sky is more than discovery in the evening sky.
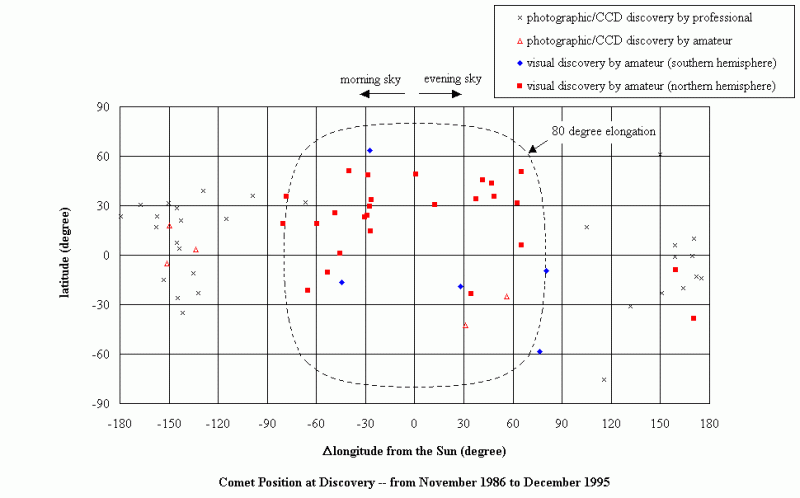
Figure 6. Comet position at discovery for "Before NEO Sky Survey"
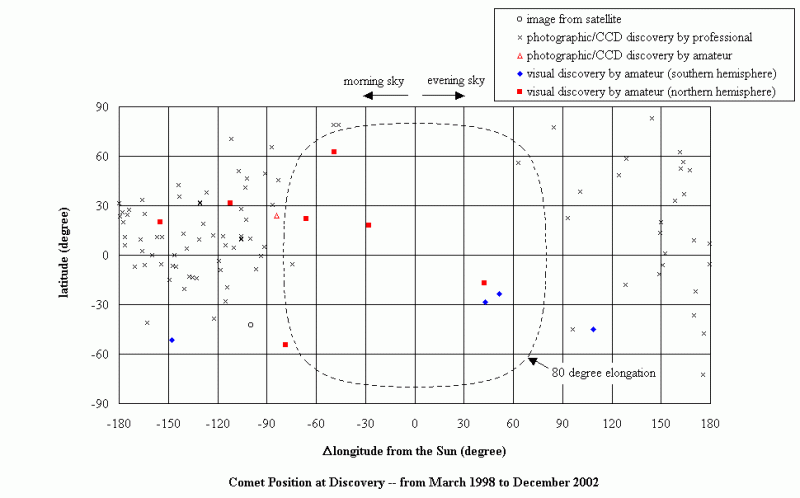
Figure 7. Comet position at discovery for "After NEO Sky Survey"
3.2 Simulation of Comet Discovery
This is a comet hunting competition in a computer. Who is the first discoverer of the comet that is randomly generated in the computer, amateur comet hunters or NEO sky surveys? The author (Taki) was an enthusiastic reader of Scientific American column "Computer Recreations" by A. K Dewdney in the 1980s. The column inspired him to perform the simulation.
Monte-Carlo method is used in the analysis. 3,000 virtual comets are generated in a computer. Visual comet hunters in the northern and the southern hemispheres and NEO sky survey in northern hemisphere are also assumed in a computer. Calculation is performed to find when the comets become bright enough to be discovered by them. Effect of atmospheric absorption is considered in the analysis.
3.2.1 Assumptions
(1) Distribution of Comets
Comets with parabolic orbits are assumed in the simulation. Distributions of the orbital elements are assumed as follows.
a. Time of passage in perihelion distributes uniformly in 25 years, from 2003 to 2027. This assumption was put in order to consider the effect of the position of the Moon and the Sun.
b. Perihelion distance distributes uniformly from 0 astronomical unit (AU) to 10 AU.
c. Longitude of ascending node and argument of the perihelion distribute uniformly from 0-degree to 360-degree.
d. Triangular distribution is assumed for inclination, no comets at 0-degree and 180-degree and the peak of the distribution is at 90-degree. This distribution is derived from the same comet discovery data described above.
e. Distribution of absolute magnitude H10 of comet is assumed to be a normal distribution with mean value of 11.0 and standard deviation of 4.0. The distribution is based on detailed analysis of the comet discovery data.
(2) Amateur Comet Hunters
a. Sky Coverage
- Lower limit of altitude at the beginning or the end of twilight: 5 degree
- The Moon should be below horizon when illumination fraction k is greater than 0.2.
b. Location
- Comet hunter in the northern hemisphere: Longitude 0 degree, Latitude 35 degree North
- Comet hunter in the southern hemisphere: Longitude 0 degree, Latitude 35 degree South
c. Limit Magnitude: 10.0 and 12.0 are considered.
(3) NEO Sky Survey
a. Sky Coverage of LINEAR Program
- We consider LINEAR is a major threat to amateur comet hunters because the sky coverage of LINEAR is the widest in the NEO sky surveys. Analyzing the sky coverage plots published in LINEAR program and the Minor Planet Center home pages, the author derived the sky coverage pattern of LINEAR as follows.
- LINEAR observes declination from -30 to +80 degree.
- In near full moon period (illuminated fraction, k >= 0.9), LINEAR does not work.
- For 0.9 > k > 0.8, LINEAR observes declination from +60 to +80 degree.
- Limitation of right ascension is limited by altitude at the beginning or the end of twilight as follows.

where,
h: altitude
 : declination
b. Location: Longitude 106-degree East, Latitude 32-degree North
c. Limit Magnitude: 18.0
3.2.2 Result of Simulation
The result of the simulation is plotted in the figures as the same manner as the actual comet discovery data. In the figures, the simulation assumes limiting magnitude of amateur discovery 10.0. Readers will be surprised with the resemblance between the simulation and the actual data. All the observation made for the actual discovery data are consistent with the result of the simulation. A big difference is that the actual discovery by amateurs in the southern hemisphere is much fewer than that in the simulation. This means that amateur comet hunters in the southern hemisphere have been missing the chance of comet discovery.
After NEO survey period the number of comets visually discoverable with the absolute magnitude brighter than 8 reduces in the northern hemisphere. This trend, the reduction of bright comet discovery on the basis of absolute magnitude in the northern hemisphere, corresponds to the actual one as mentioned above.
The explanation of this finding is as follows. The comets with brighter absolute magnitude enter the coverage of the NEO surveys when they are far away from the Sun and not bright enough for the amateur comet hunters' reach. Some of the comets with fainter absolute magnitude and small perihelion distance increase brightness up to the limiting magnitude for the amateur comet hunters, when they approach the Sun without entering the coverage of the NEO surveys. The plot of discovery position for after NEO sky survey obtained by the simulation suggests where to search.
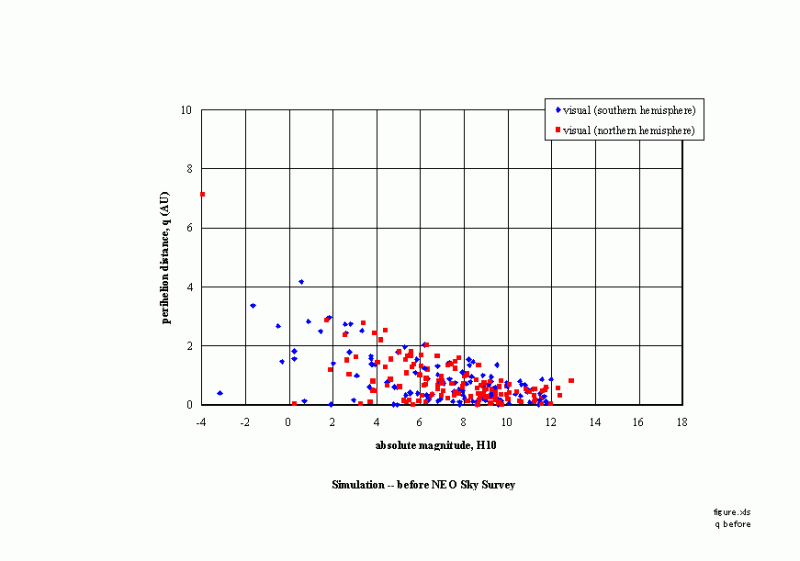
Figure 8. Absolute magnitude and perihelion distance plot for "Before NEO Sky Survey" by simulation - visual limit magnitude 10.0
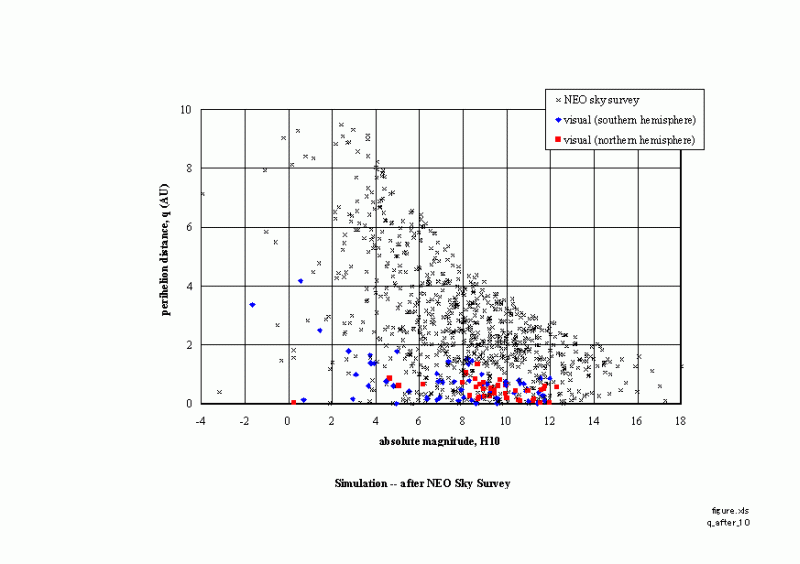
Figure 9. Absolute magnitude and perihelion distance plot for "After NEO Sky Survey" by simulation - visual limit magnitude 10.0
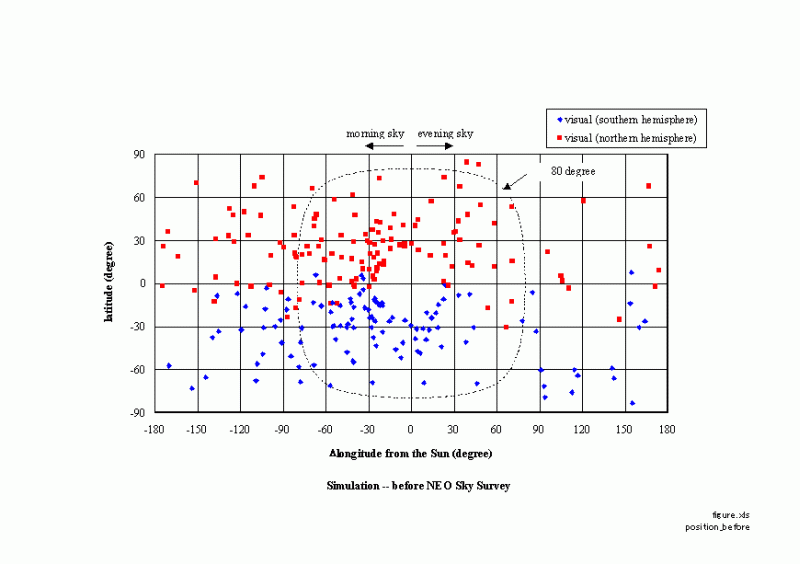
Figure 10. Comet position at discovery for "Before NEO Sky Survey" by simulation - visual limit magnitude 10.0
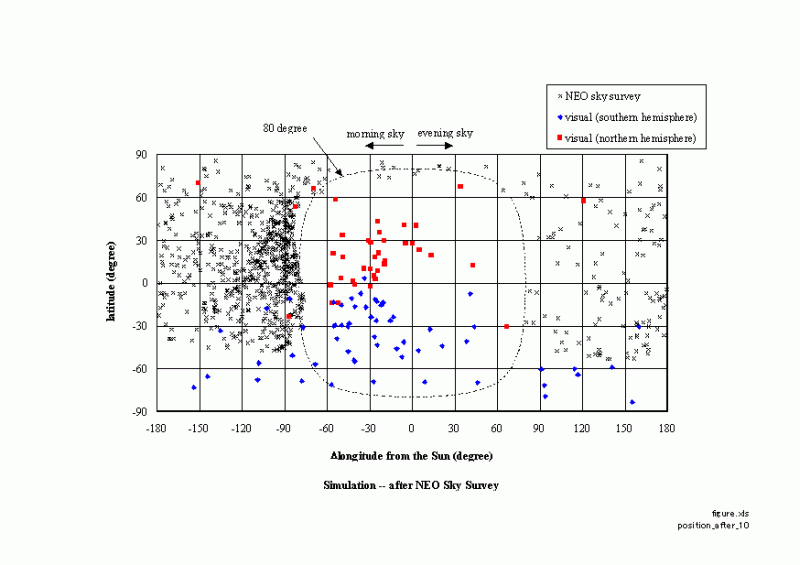
Figure 11. Comet position at discovery for "After NEO Sky Survey" by simulation - visual limit magnitude 10.0
The figure below shows comet discovery rate per year obtained from the simulation. The comet discovery rate of NEO sky survey is assumed to be the same value as the actual data, 19.0. Again, the simulation is consistent with the actual data except for the discovery rate of amateur comet hunters in the southern hemisphere. Amateur discovery rate from the northern hemisphere after NEO sky survey becomes one third of before NEO sky survey. The impact of NEO survey to amateur comet hunters in southern hemisphere is much less.
In the both hemispheres, if you make the limiting magnitude of your telescope darker from 10 to 12, it would give rise to the chance of discovery by 50%. While this requires 2.5 times larger aperture telescope and the same applies to the low magnification, which narrows the actual field of view. Thus, your search area per unit time is to be reduced and you do not know whether the large aperture is effective or not. It seems that there is no royal telescope for comet hunting.
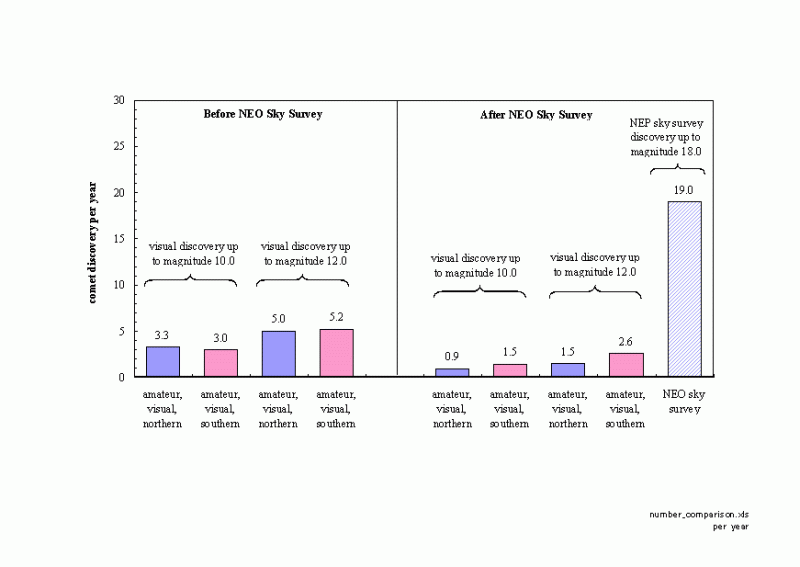
Figure 12. Comet discovery rate comparison by simulation
3.2.3 Competition and Cooperation for Near Earth Comet Discovery
The following two figures show how severe the competition is.
500 near earth comets with perihelion distance smaller than 1.0 are considered here. The square with black solid line shows numbers of comets which can be discovered by the NEO sky survey if amateur comet hunters do not work. The square with blue solid line shows numbers of comets which can be discovered by the amateur comet hunters in the northern hemisphere if the amateurs in the southern hemisphere and the NEO sky survey do not operate. The square with red solid line shows numbers of comets which can be discovered by the amateur comet hunters in the southern hemisphere if the amateurs in the northern hemisphere and the NEO sky survey do not operate. Number of comets in each block enclosed by solid lines is shown in the figures.
Competition occurs where the squares overlap. Overlap between the NEO sky survey and the amateur comet hunters is large and the NEO sky survey has an advantage over the amateur comet hunters in the overlapped area.
The NEO sky survey and the amateur comet hunters can discover 68% to 76% of the near earth comets (perihelion distance, q<1.0). Most of the undiscovered comets are small ones with faint absolute magnitude. Note that the NEO sky survey misses many near earth comets. Without the amateur comet hunters, the discovery rate of near earth comets will decrease to 60%. The amateur comet hunters compete with the NEO sky survey, and also complement it.
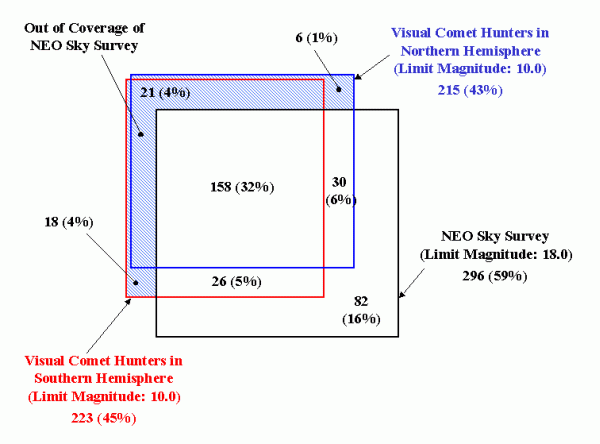
Figure 13. Discovery rate of near earth comets by simulation - visual limit magnitude 10.0
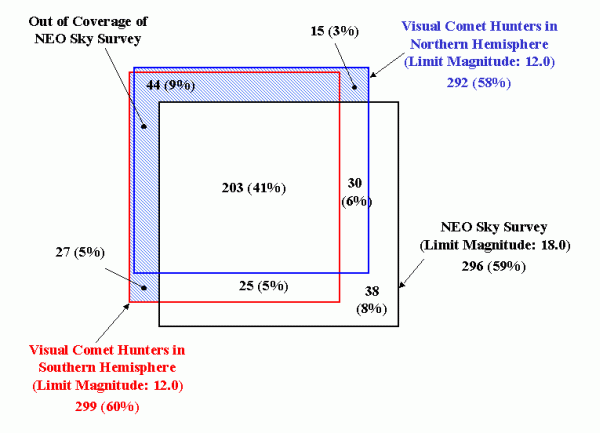
Figure 14. Discovery rate of near earth comets by simulation - visual limit magnitude 12.0
4. Conclusion
Comet hunters can survive for the time being, though the discovery rate reduced to one third in the northern hemisphere after NEO sky survey. In the southern hemisphere if the search becomes active higher discovery rate is expected than the statistics to date.
When Kaoru Ikeya discovered his 6th comet 153P Ikeya-Zhang, 35 years has been past since his last discovery (Sky & Telescope, July 2002, p.70-73). Shigehisa Fujikawa has spent 24 years to find his 5th comet that named him, C/2002 X5 Kudo-Fujikawa. Both of them continued comet hunting for decades of years without hesitation. Tsutomu Seki emphasizes importance of self-confidence and dedication; "Strong rivals exist at any era and only comet hunters who fight bravely and attack openly are crowned with victory".
Unless complete sky coverage of the NEO sky surveys is realized, amateur comet hunters can survive but they have to swim with the sharks. Comet hunting goes on.
5. References
[1] "The Searches for Near-Earth Objects," Sky & Telescope, December 2000, p. 32.
[2] "The Comet Master", Sky & Telescope, July 2002, p. 70-73.
[3] Jean Meeus, "Astronomical Algorithms," Willmann-Bell, Inc., 1991.
=============================================================================
About the Authors
Toshimi Taki
Toshimi Taki is an aircraft engineer by profession and he is a member of Oriental Astronomical Association (OAA), which is the oldest amateur astronomical society in Japan. He is interested in astronomical computing and telescope making. His articles on mirror cell analysis and a program for digital setting circle appeared in Sky & Telescope. His e-mail address is zs3t-tk@asahi-net.or.jp.
Shigeki Murakami
Shigeki Murakami is a forest hydrologist and a snow scientist of the Japanese National Institute, Forestry and Forest Products Research Institute. He is a discoverer of C/2002 E2 Snyder-Murakami and also a member of OAA. You can contact him at cometsm@nifty.com.
 Return to Home


 : Distance of comet from the Earth


 : declination


